Markets

The U.S. Territory of Guam

Traffic Counts

2030 Guam Transportation Plan - Guam Islandwide Program Management Services

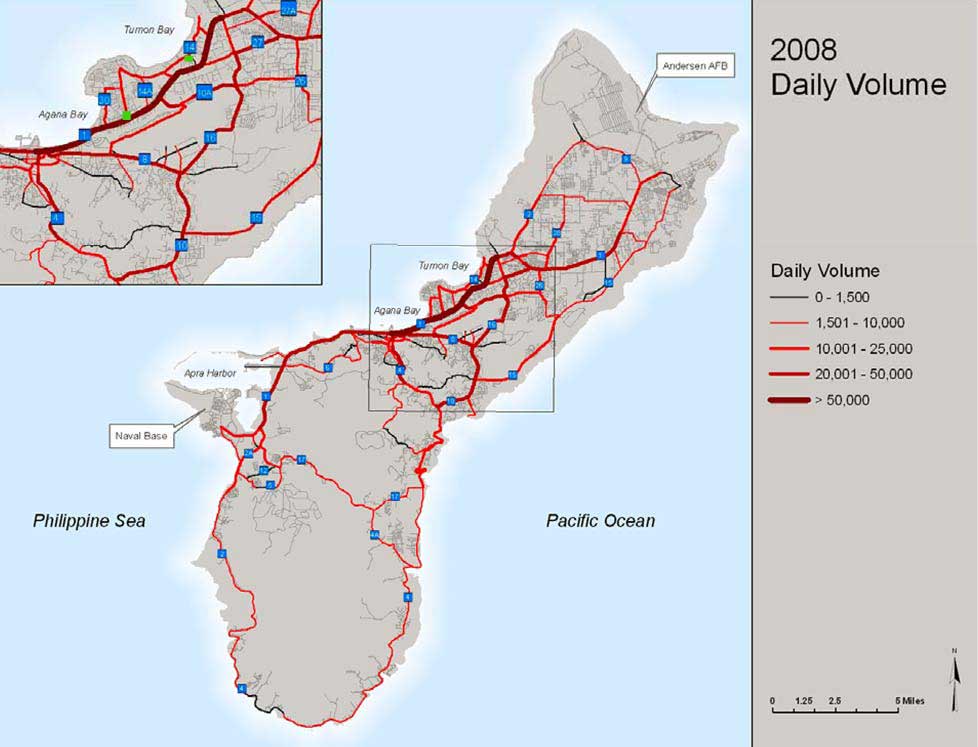
Traffic levels on Guam are increasing. Between 2003 and 2008, traffic on Routes 1, 2, 3, 10, 14, and 16 increased from 20 to 80 percent. Patterns of traffic congestion in 2008 are shown in the map below. Tri Vision Media’s current electronic billboards are highlighted with green blocks on the inset map.

map-guam-traffic1-rev

2011 Guam Traffic Count for Route 1: North of Route 14 the ITC intersection.

Weekday Average Counts Conducted (Tues.-Thurs.) 3/15/11 to 3/17/11

North Bound Daily 26,199

South Bound Daily 27,643

At this strategic location, the average daily traffic volume stands at 53,842 vehicles. With Guam’s average of 1.75 passengers per car, the viewership at this strategic location stands at an average of 94,224 viewers daily.

Production Specs

Proof OOH Works